Affinity & Structure Banks
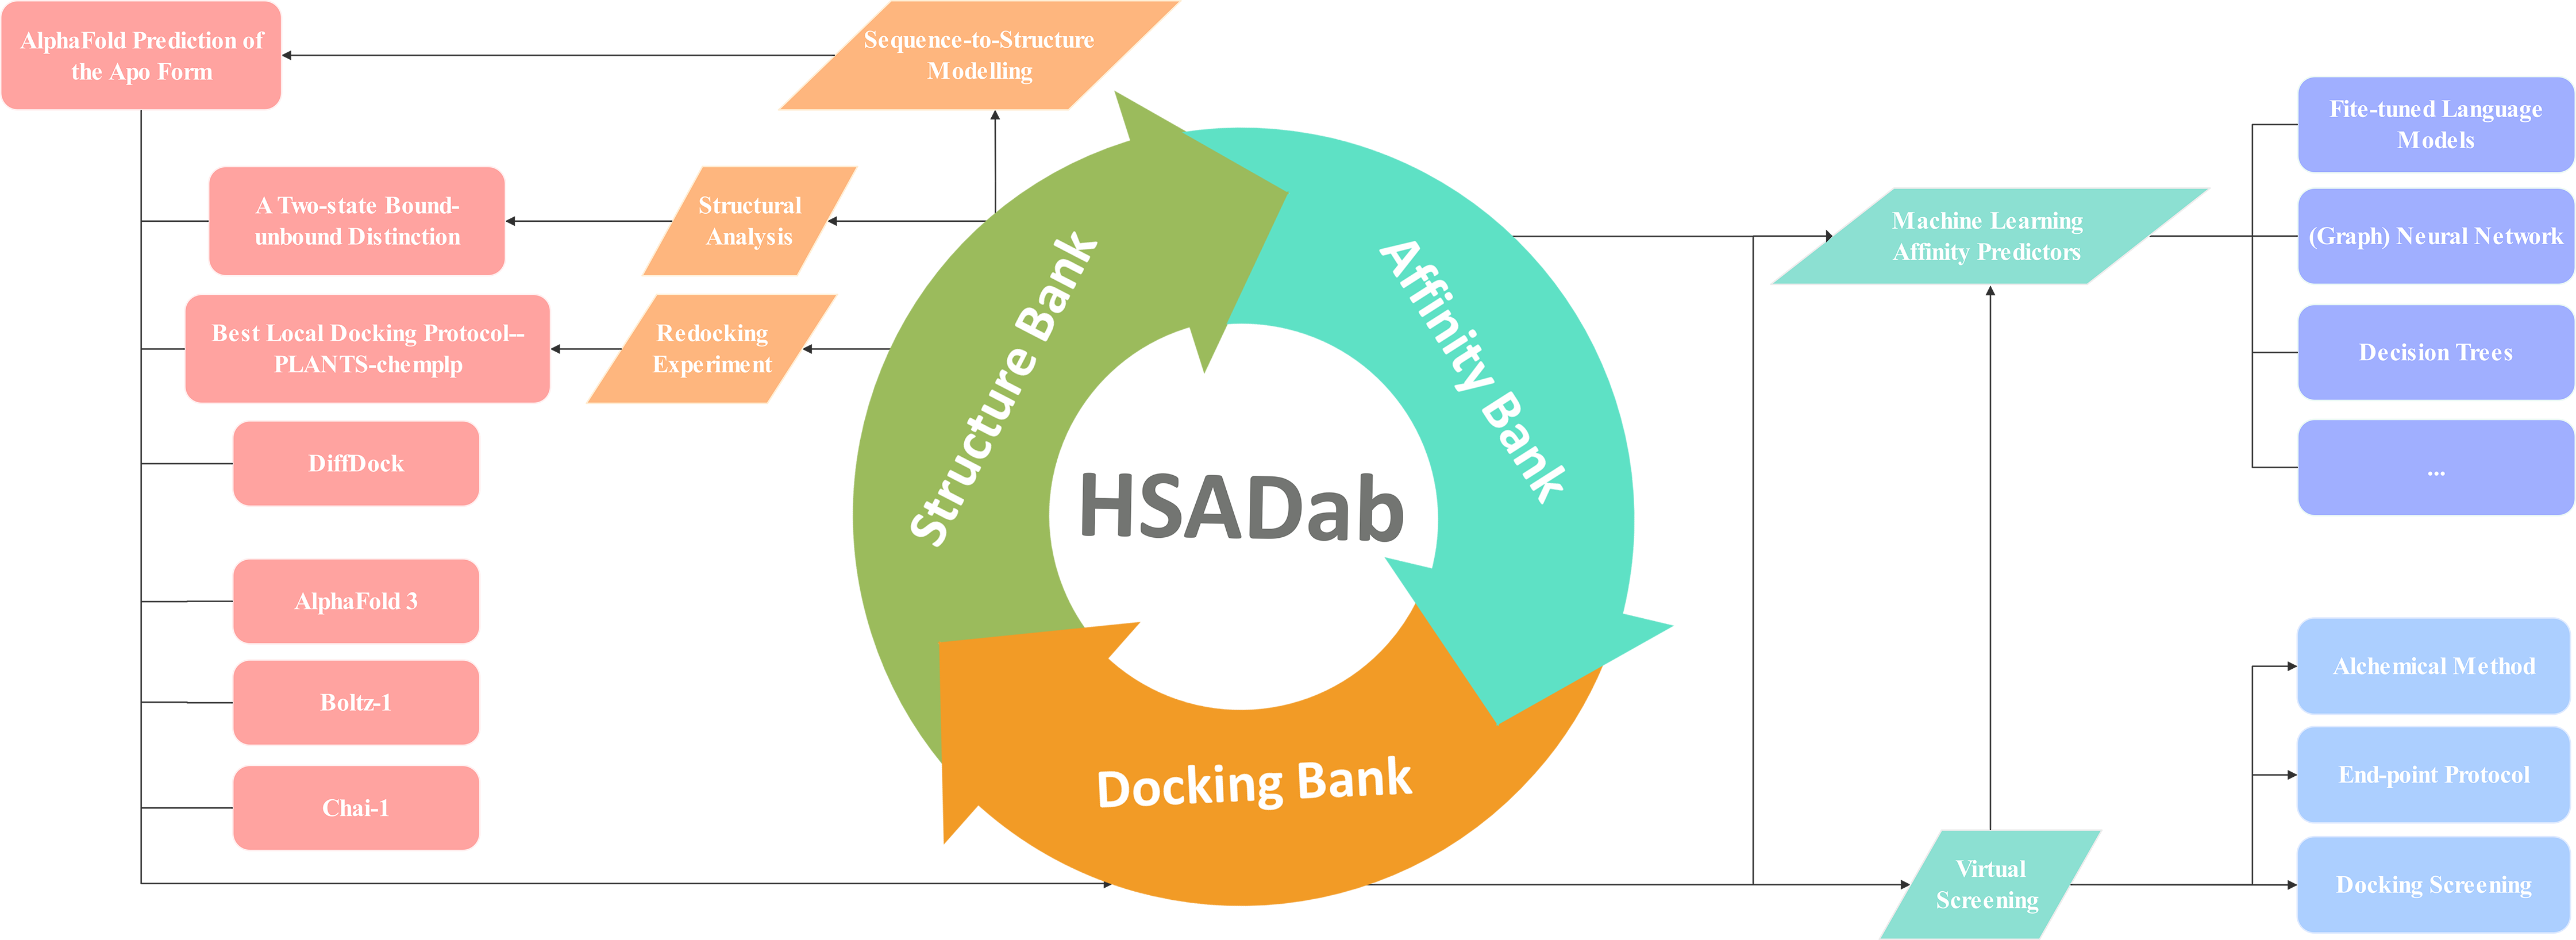
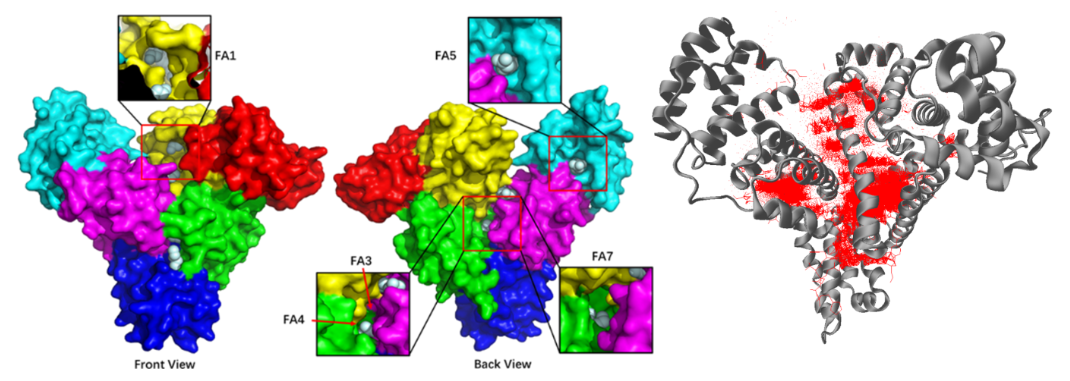
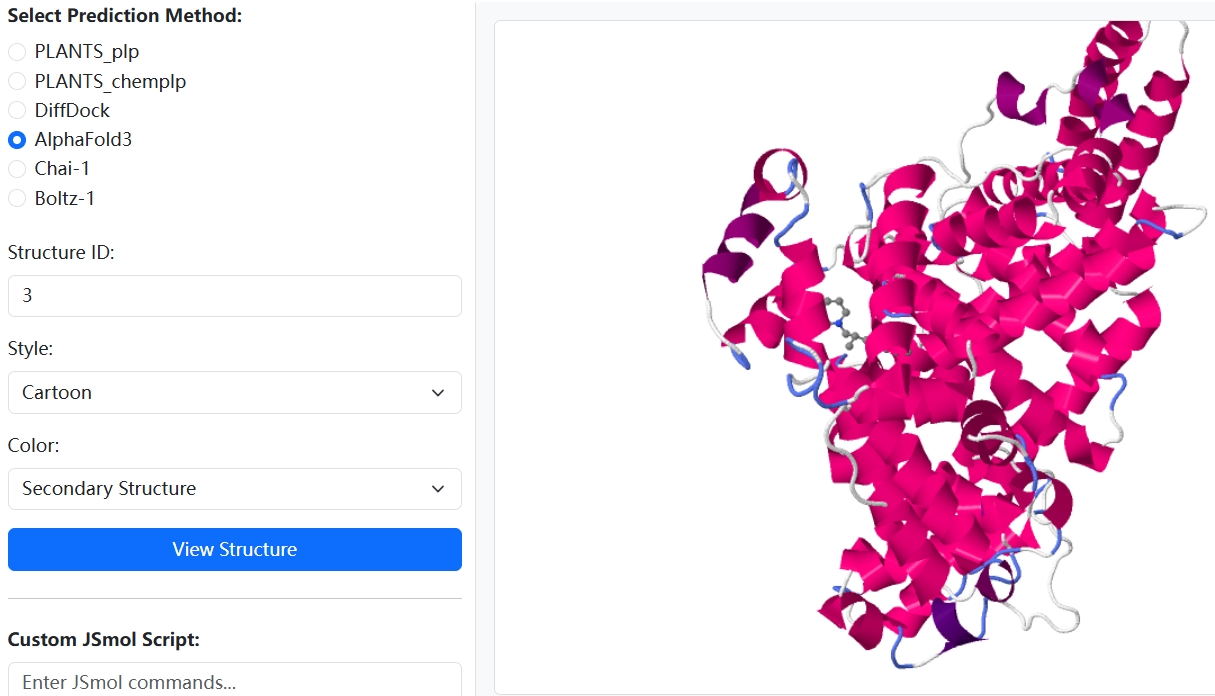
HSADab is the most comprehensive database for binding thermodynamics and all-atom structures of human serum albumin. The three pillars of HSADab are affinity, structure and docking banks. The affinity bank contains binding thermodynamics of several thousand ligands towards HSA, with multiple temperature labels available. The structure bank contains all experimentally deposited HSA-related biomacromolecules, including not only the apo form and the ligand- or antibody-bound forms. The docking bank is constructed with the best local docking protocol PLANTS, the deep-learning tool DiffDock, and the current SOTA integrative deep-learning structural predictors AlphaFold3, Boltz-1 and Chai-1.
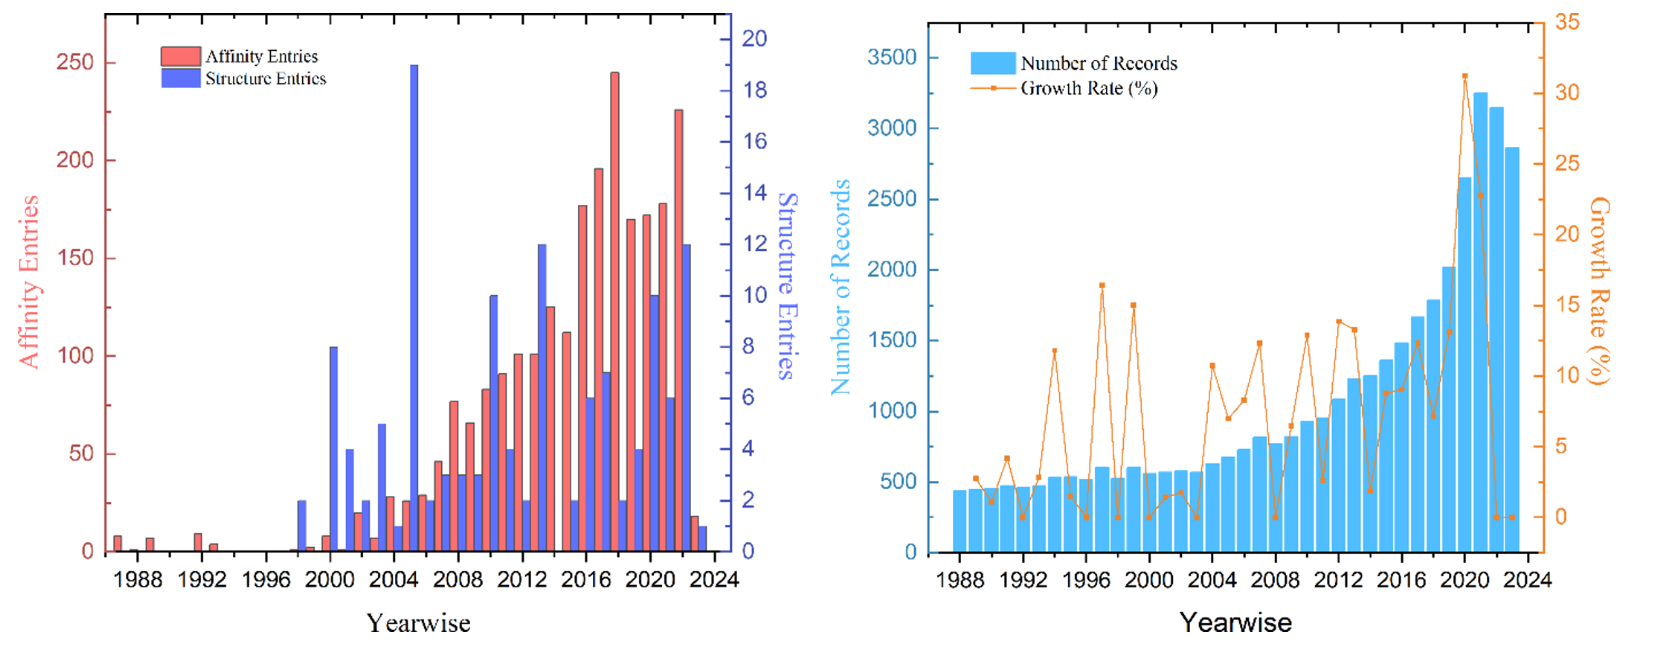
The database is secured through an extensive literature review of more than 40,000 published contents relevant to HSA, covering 1987 to 2024.06. The current affinity and structure banks contain all reported data for HSA binding affinities and HSA-involved 3D structure data. In total, we have several thousand affinity data measured experimentally available, but merely ~130 structures are deposited so far.
Docking Bank
The docking bank contains HSA-ligand complex structures predicted by many main-stream structure predictors, including current best-performing integrative biomolecular modelling tools AlphaFold3, Boltz-1, and Chai-1 and docking protocols DiffDock, PLANTS-chemplp and PLANTS-plp. Due to the dependence of the docking outcomes on the protein template, we select 4 representative HSA structures, including 1ao6 (the apo state), 5yb1 and 8ew4 (two bound conformations) and an AlphaFold-predicted structure.

All molecules in the affinity bank are 'docked' towards the protein template. Consequently, the naming protocol of the docking bank follows exactly that of the affinity bank.
Affinity Predictor
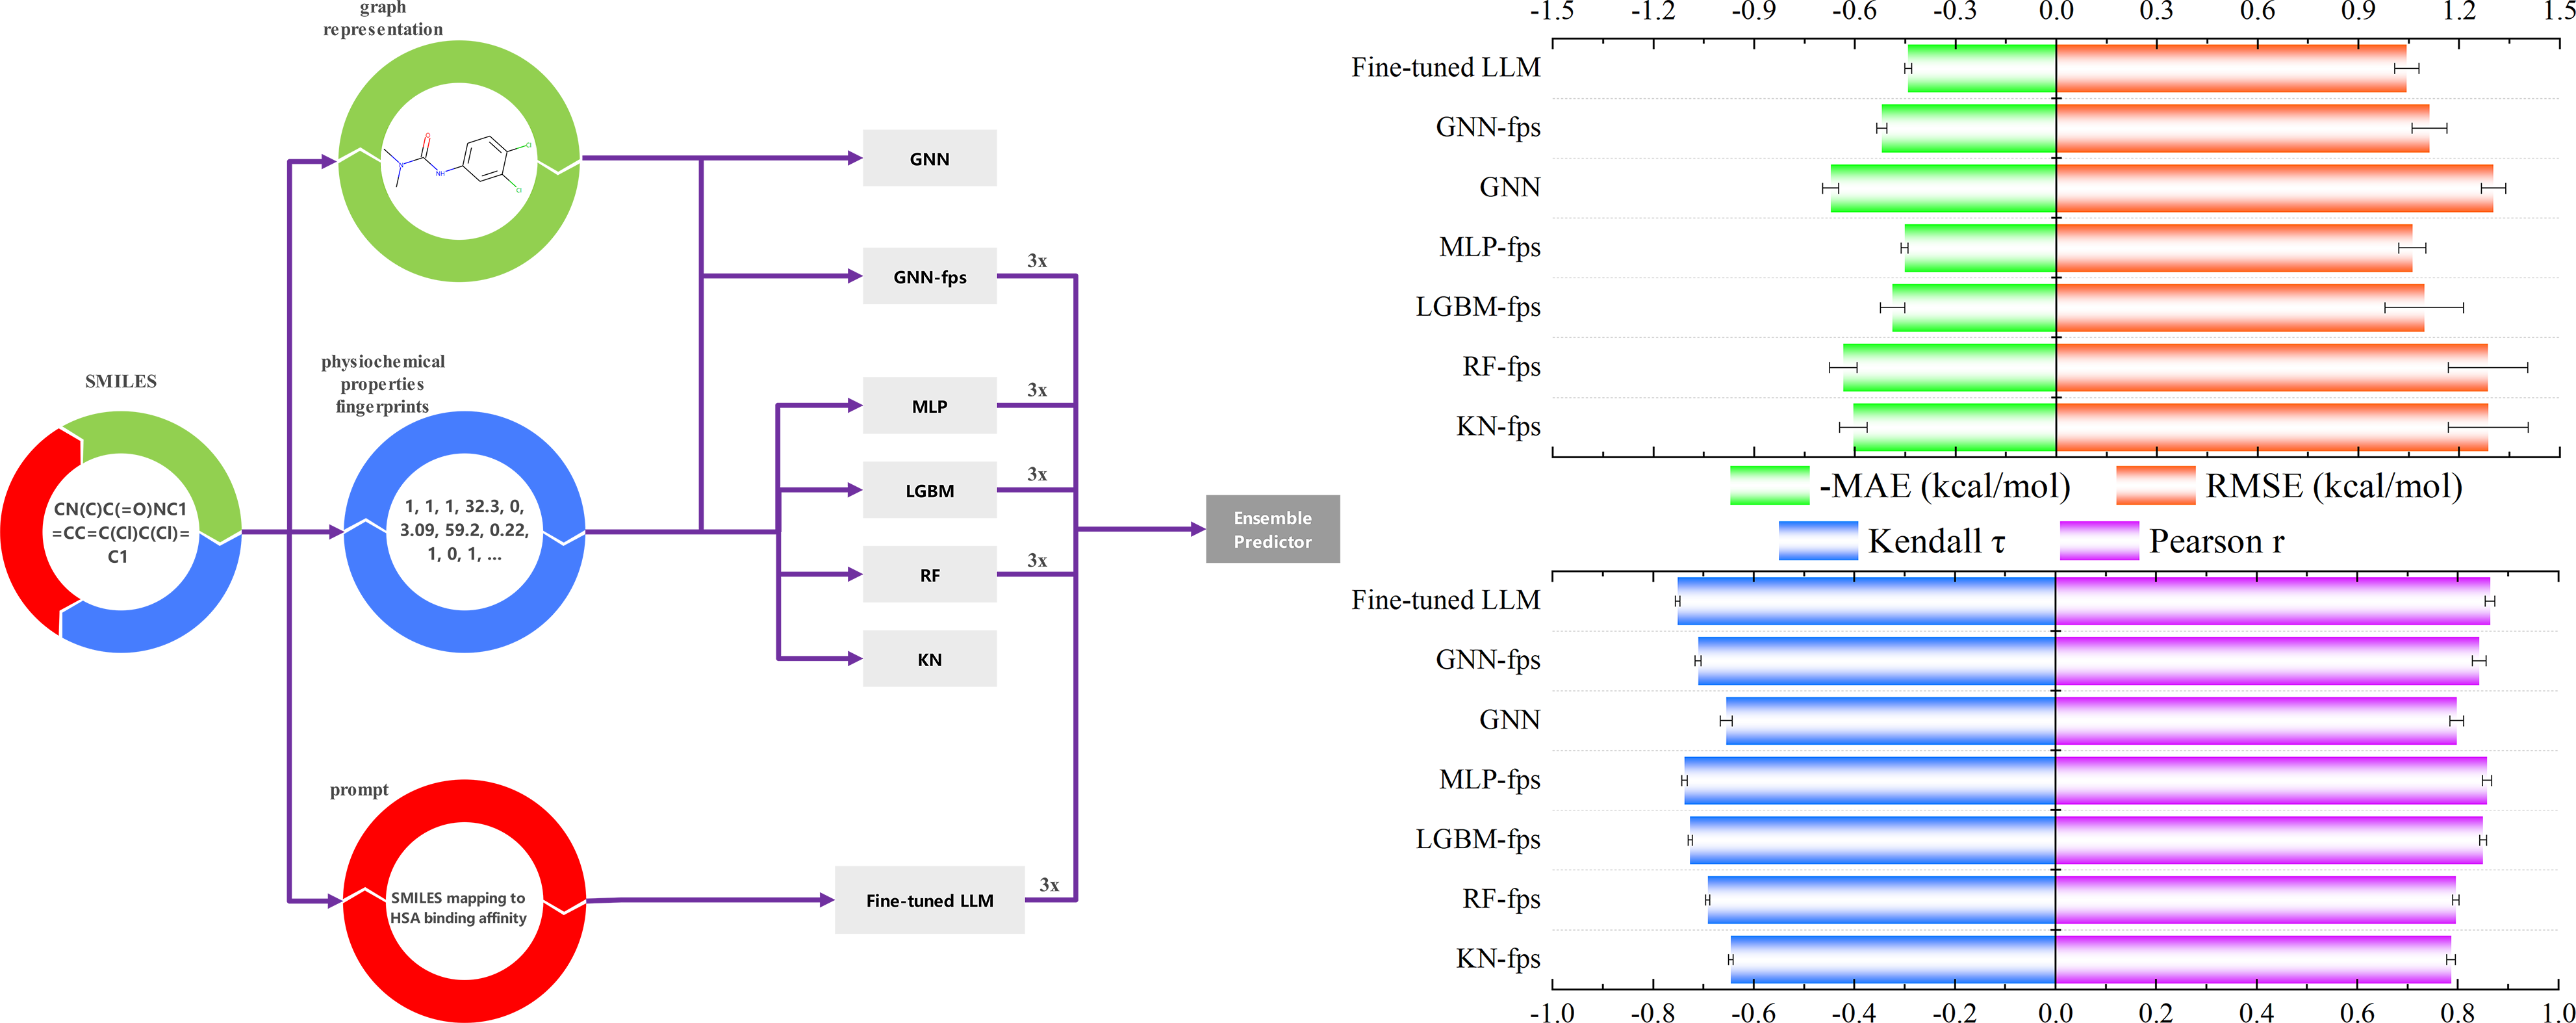
We trained a series of machine-learning predictors for HSA binding affinities using our database. Our implementation incorporates multi-modal representations, including fingerprints, physio-chemical properties, molecular graph and language models. We generally consider ensemble predictors that combines predictions of multiple implementations. Even for the same predictor, we train three repeats to increase the robustness. A performance comparison between different ML predictors is given below. The 'Affinity Predictor' page enables instant affinity predictions, and the source code of the cost-effective ensemble model is available in GitHub.
Plasma Protein Binding (PPB) Prediction
Plasma Protein Binding (PPB) is a critical pharmacokinetic property, as it is essential for determining a drug's ADMET (absorption, distribution, metabolism, excretion, and toxicity) properties—particularly its free fraction, distribution, and efficacy.
This feature is implemented as an additional prediction "head" within our multi-task machine learning framework. It takes key physicochemical properties of a molecule (such as LogP, Polar Surface Area, H-Bond Donors/Acceptors, Molecular Weight, etc.) as input features and performs a LogIt-based estimation.
The predicted value is the LogIt transformation of the drug's bound fraction f_b, calculated using the formula:

The dataset used to train this model was aggregated from existing publications, and its performance is reported to be comparable to or better than modern tools like ADMETLab 3.0.
Group Contribution Analysis
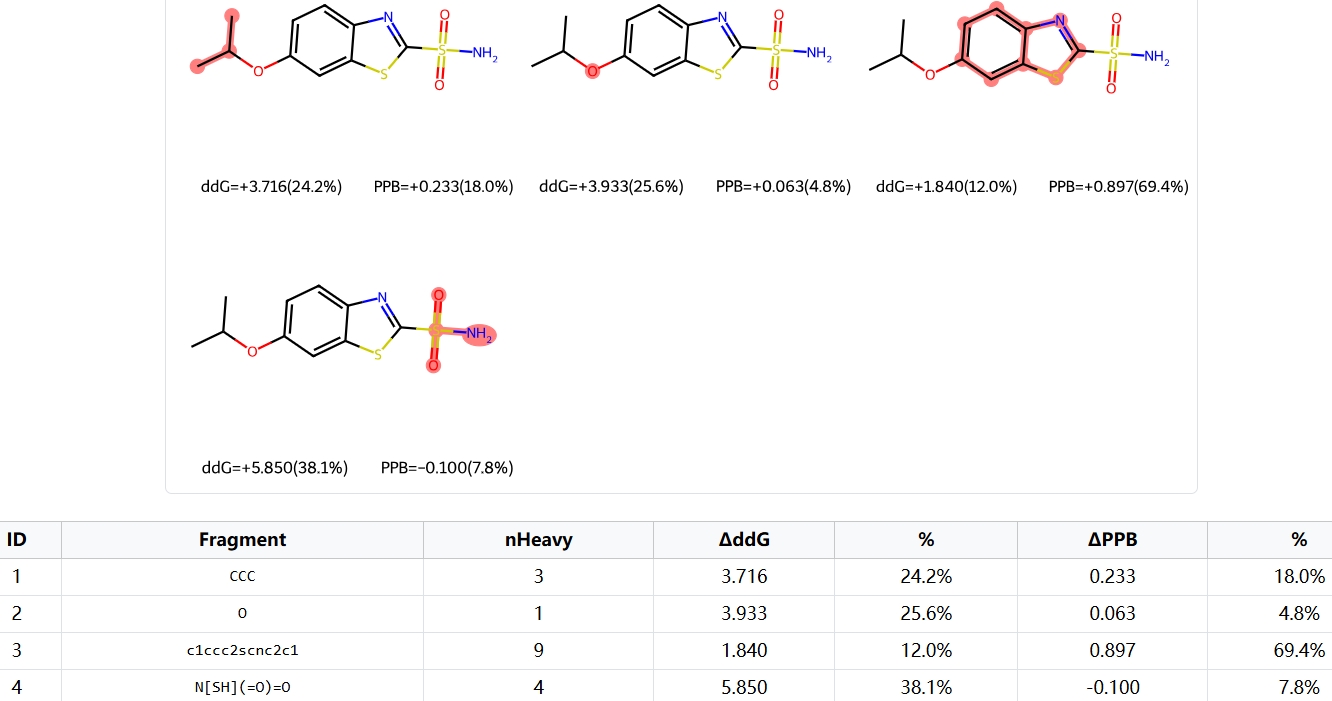
Fragment contribution analysis is an indispensable tool in drug development. It provides a fast, interpretable way to estimate key properties directly from a molecule's structure. This capability accelerates early-stage screening and guides rational molecular modifications by helping to identify key structural features.
Our method implements a "group-decomposition regime". As shown in the example images, molecules are systematically broken into fragments by partitioning them at their rotatable bonds. The contribution of each fragment is then calculated using a "leave-one-fragment-out" method.
This process involves computationally "ablating" (removing) a single fragment and measuring the resulting drop in the model's prediction for binding affinity or PPB. The final table quantifies each fragment's specific impact, providing an interpretable framework to guide molecule design.
Experimental Measurements
Diverse experimental methods are employed to secure the binding data. As these method-specific details are recorded in our database, in this section we briefly detail the background and related properties in experimental measurements.
Method 1. Fluorescence Spectroscopy
Fluorescence spectroscopy is a vital technique used to analyze drug-protein interactions, focusing on the quenching mechanisms within protein-drug complexes such as the Ligand-HSA complex. Quenching, which reduces the fluorescence quantum yield, occurs through dynamic (collisional) or static (complex formation) mechanisms. Dynamic quenching depends on diffusion, with quenching constants increasing with temperature. Static quenching, involving non-fluorescent ground-state complex formation, shows decreased stability at higher temperatures, leading to lower quenching constants. An energy-transition illustration relating to the fluorescence spectroscopy is shown in Fig. 1.
HSA's fluorescence mainly arises from tryptophan (Trp), tyrosine (Tyr), and phenylalanine (Phe). Accurate fluorescence data requires correcting for the inner filter effect due to ligand absorption at excitation and emission wavelengths, using the equation:
The Stern-Volmer equation analyzes quenching data:
where significant kq values over 2.0×10¹⁰ L・mol-1s-1 suggest static quenching.
Binding interactions between small molecules and HSA are further explored using the modified Stern-Volmer equation:
where ΔF is the fluorescence difference, fa is the fraction of accessible fluorescence, and Kb is the binding constant.
The double logarithm method is expressed as:

This measures binding sites (n) and binding constants. An n value approximating 1 indicates a single binding site within the experimental range. In Fig. 1, we present an illustrative example using the double-logarithm method to measure the binding thermodynamics of HSA-drug interactions.
The Scatchard method analyzes binding quantitatively by representing the number of moles of bound drug per mole of protein and the molar concentration of free small molecules:
However, this method can be inaccurate for compounds like flavonoids due to their varied fluorescence properties and the differently ionized forms of protein-bound ligands. Therefore, binding constants from Scatchard analysis may be underestimated.
The Lineweaver-Burk method is also used to calculate binding constants:
Fluorescence resonance energy transfer (FRET) measures distances between proteins and drugs. Förster’s non-radiative energy transfer theory calculates parameters like energy efficiency (E), critical energy-transfer distance (R0), and donor-acceptor distance (r). These parameters are derived from equations such as:

where k2 is the orientation factor, ΦD is the donor's fluorescence quantum yield, N is the medium's refractive index, F(λ) is the donor's fluorescence intensity at wavelength λ, and ε(λ) is the acceptor's molar absorption coefficient. Typically, k2 = 2/3, N = 1.336, and Φ ranges from 0.074 to 0.15.
The energy efficiency (E) is calculated as:
where F and F0 are donor fluorescence intensities in the presence and absence of the acceptor.
If the average distance (r) between HSA and small molecules is within 2-8 nm, and R0< r < 1.5 R0, it suggests energy transfer and static quenching interactions according to Förster's theory. These methods collectively enhance the understanding of drug-protein interactions.
Fig. 1. The Jablonski diagram illustrating transitions between energy states and an illustration of the double-log plot.
Method 2. ITC
ITC is a commonly used technique for studying the interaction of a protein with small molecules. It involves the measurement of change in energy during complex formation. Among the techniques able to evaluate interaction thermodynamics, only ITC can simultaneously measure the thermodynamic binding constant (Kb), closely related to free energy variation (ΔG), enthalpy (ΔH), entropy (ΔS) variations, and interaction stoichiometry (n). The advantage of ITC over other thermodynamic techniques is the ease of collecting data with the least number of experiments and without requiring probe or ligand immobilization on a surface. However, ITC data can suffer due to its sensitivity to temperature, pH, and other environmental factors, and has low sensitivity to weak interactions.
Poor or variable sample preparation can lead to drastically different isotherm profiles and inconsistent data analysis. In Fig. 2, an illustration of ITC measurements is presented. Heat capacity change (ΔCp) is calculated by the first derivative of temperature dependence of the enthalpy change, i.e.:

Fig. 2. An illustration of the ITC measurements in HSA-drug interactions.
Method 3. UV-Vis Absorption Spectroscopy
UV-Vis absorption measurement is often used to explore protein structural changes and investigate protein-ligand complex formation. Binding constants and thermodynamic parameters of the complex can be obtained from UV-Vis absorption spectroscopy. The method works by detecting the UV absorbance variation upon binding/unbinding, i.e.:

Then Lineweaver-Burk plot or double reciprocal plot can be plotted and binding constant K of ligand-protein complex can be obtained. See Fig. 3 for an illustrative UV-Vis absorption measurement in HSA-drug interactions.
Fig. 3. An illustration of the UV-Vis measurements in HSA-drug interactions.
Method 4. Others
Various techniques such as mass spectrometry, chromatography (including high-performance liquid chromatography, high-performance affinity chromatography, ultrafiltration chromatography, and electrokinetic chromatography), nuclear magnetic resonance (NMR), circular dichroism, and equilibrium dialysis can be employed to study drug interactions with HSA.
Data Format Explanation
For each record, we present the data in two blocks. The data entries reported in the original txt format database are as follows. The first block contains background information (e.g., the citation and title).
Title Information
| Attribute | Description |
|---|---|
| Article Title | |
| DOI | Paper's DOI number |
| Ligand Name | Ligand name in the paper |
| Ligand SMILES | Isomeric SMILES from PubChem or output from Reaxy |
| Key Residue (H-bond)* | |
| Key Residue (Hydrophobic)* | |
| PDB ID | PDB ID of ligand-HSA complex crystal structure in the paper |
| Binding Area* |
The data block reports experimentally measured thermodynamic and kinetic data.
| Analytical method | Parameter | Explanation of parameter | Units | Total Amount |
|---|---|---|---|---|
| Fluorescence spectroscopy experiment data | parameter | |||
| pH | ||||
| T | Kevin temperature | K | ||
| KSV | Stern-Volmer constant | M−1 | 3948 | |
| kq | Bimolecular quenching rate constant | M−1s−1 | 31100 | |
| n | Binding stoichiometry (binding site) | 3518 | ||
| K | Equilibrium constant | M−1 | 333 | |
| Ka | Association constant | M−1 | 1100 | |
| Kb | Binding constant | M−1 | 3903 | |
| ΔH | Enthalpy change | kJ mol-1 | 3831 | |
| ΔS | Entropy change | J mol-1K-1 | 3811 | |
| ΔG | Gibbs free energy change | kJ mol-1 | 3967 | |
| Kd | equilibrium dissociation constant | μmol L-1 | 33 | |
| FRET from Steady State Measurements | parameter | |||
| pH | ||||
| T | Kevin temperature | K | ||
| J | Overlap integral | cm3L mol-1 | 620 | |
| E | Energy efficiency | 620 | ||
| R0 | Critical energy-transfer distance | nm | 671 | |
| r | The energy donor and the energy acceptor distance | nm | 678 | |
| F0 | Fluorescence intensities (no quencher) | 7 | ||
| F | Fluorescence intensities (with quencher) | 8 | ||
| Thermodynamics binding parameters (ITC) | parameter | |||
| pH | ||||
| T | Kevin temperature | |||
| n | Binding stoichiometry (binding site) | 179 | ||
| K | Equilibrium constant | M−1 | 24 | |
| Ka | Association constant | M−1 | 40 | |
| Kb | Binding constant | M−1 | 177 | |
| ΔH | Enthalpy change | kJ mol-1 | 297 | |
| ΔS | Entropy change | J mol-1K-1 | 282 | |
| ΔG | Gibbs free energy change | kJ mol-1 | 241 | |
| Cp | heat capacity | J mol-1K-1 | 52 | |
| Kd | equilibrium dissociation constant | μmol L-1 | 36 | |
| UV-vis absorption spectroscopy | parameter | |||
| pH | ||||
| T | Kevin temperature | K | ||
| n | Binding stoichiometry (binding site) | 1 | ||
| K | Equilibrium constant | M−1 | 0 | |
| Ka | Association constant | M−1 | 1 | |
| Kb | Binding constant | M−1 | 38 | |
| ΔH | Enthalpy change | kJ mol-1 | 20 | |
| ΔS | Entropy change | J mol-1K-1 | 26 | |
| ΔG | Gibbs free energy change | kJ mol-1 | 25 | |
| Kd | equilibrium dissociation constant | μmol L-1 | 6 | |
| Other method | methods | |||
| parameter | ||||
| pH | ||||
| T | Kevin temperature | K | ||
| n | Binding stoichiometry (binding site) | 46 | ||
| K | Equilibrium constant | M−1 | 20 | |
| Ka | Association constant | M−1 | 2 | |
| Kb | Binding constant | M−1 | 18 | |
| ΔH | Enthalpy change | kJ mol-1 | 63 | |
| ΔS | Entropy change | J mol-1K-1 | 10 | |
| ΔG | Gibbs free energy change | kJ mol-1 | 10 | |
| Kd | equilibrium dissociation constant | μmol L-1 | 4 | |
| Kinetic Parameters Describing Michaelis-Menten Constant | HSA/Ligand | Ratio of HSA to Ligand | ||
| RA | Relative activity | |||
| Vmax | Maximal velocity | μM s-1 | ||
| Km | Michaelis-Menten constant | μM | ||
| kcat | Catalytic constant | s-1 | ||
| kcat/Km | Catalytic efficiency | μM-1s-1 | ||
| Changes in the ASA(Å2) Values | residues | Residue name&No | ||
| ASA of HSA | Accessible surface area of HSA | Å2 | ||
| ASA of com | Accessible surface area of complex | Å2 | ||
| ΔASA | Accessible surface area change | Å2 | ||